
 Yahoo Autos
 Cars Are Half as Colorful as They Were 20 Years Ago
Highlights:
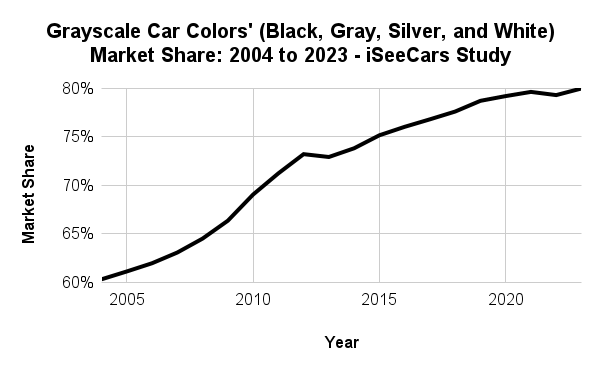
Grayscale colors (white, black, gray and silver) made up 80 percent of cars in 2023 compared to 60.3 percent in 2004
Gray gained the most market share since 2004, up 81.9 percent; followed by white gaining 77.4 percent; silver was the biggest grayscale loser, down 52.2 percent
Every other color lost share, with the biggest losers being gold (-96.8 percent), purple (-92.7 percent), brown (-86.5 percent), beige (-85.3 percent) and yellow (-75.7 percent)
This drop in diversity comes despite nearly the same number of colors being offered in 2023 versus 2004 – with an average of 6.7 colors per model today compared to 7.1 colors per model 20 years ago
Green is the only non-grayscale color to increase share in recent years, with a small improvement since 2020
Colorful cars continue to lose ground against the ever-dominant shades of white, black, gray, and silver – often referred to as grayscale colors. In the 2004 model year, grayscale cars made up 60.3 percent of the market. Twenty years later, their share has moved to 80 percent, cutting the percentage of non-grayscale cars in half. Among these dominant shades, gray made the biggest move up, gaining 81.9 percent. Silver was the biggest loser, dropping 52.2 percent.
iSeeCars analyzed the colors of over 20 million used cars from model years 2004 - 2023 sold from January 2023 to April 2024. The share of each color within each model year was calculated, as was the difference in share between model years 2004 and 2023.
“Colorful cars appear to be an endangered species,” said Karl Brauer, iSeeCars Executive Analyst. “Despite a diverse palette being offered by automakers, there are far fewer non-grayscale cars sold today. They’ve lost half their market share over the past 20 years, and they could become even rarer in another 20 years.”
The Grayscale March: Ever Upward?
The growth in grayscale colors has been constant over the past two decades, with only a slight pullback between 2012 and 2013. In the past three years the curve seems to be plateauing, suggesting the market may be approaching a saturation point for white, black, gray, and silver vehicles. This drop in the car color spectrum occurred despite nearly identical color offerings per model over the past 20 years, with 6.7 colors available for the average 2023 car versus 7.1 colors for the average model in 2004.
“Will grayscale shades drive out all other car colors over the next 20 years? A flattening of the curve in the past few years indicates a possible maximum market tolerance for these four colors,” said Brauer. “Whether driven by dealers ‘playing it safe’ by ordering only popular colors, or consumers wanting to ensure maximum interest when it’s time to sell or trade in their vehicle, grayscale colors play the dominant role in the car world.”
Car Color Market Share Trends
The rise of grayscale cars is reflected in three of the four grayscale colors. White is the most dominant car color today, after passing black about 10 years ago and continuing to climb. Gray’s massive gains over the past decade has given it almost as much share as black. Black has also increased its market share by more than half. Bucking the trend of the grayscale colors, while silver has consistently lost market share since 2004.
The remaining car colors combined have lost almost half of their market share since 2004. Obscure colors like gold, purple, brown, and beige have each lost more than 80 percent of their share over this period. But even more mainstream colors like green, red, and blue gave up some share. Interestingly, green has made a small comeback in the last few years as the only non-grayscale color to gain market share since 2020.
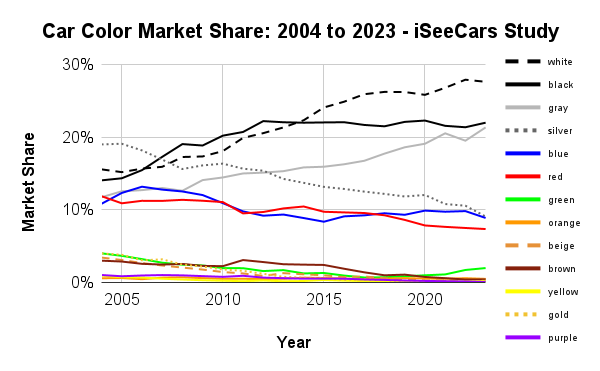
“The big mover over the past 20 years is gray, which grew by 81.9 percent in share since 2004,” said Brauer. “The biggest loser among popular car colors is silver, dropping 52.2 percent and just barely ahead of blue in today’s market share.”
Car Color Market Share – iSeeCars Study | |||
Color | 2023 | 2004 | % Change |
White | 27.6% | 15.6% | 77.4% |
Black | 22.0% | 14.0% | 56.5% |
Gray | 21.3% | 11.7% | 81.9% |
Silver | 9.1% | 19.0% | -52.2% |
Blue | 8.9% | 10.8% | -18.0% |
Red | 7.3% | 11.9% | -38.1% |
Green | 2.0% | 4.0% | -50.6% |
Orange | 0.5% | 0.6% | -14.8% |
Beige | 0.5% | 3.4% | -86.3% |
Brown | 0.4% | 3.0% | -86.5% |
Yellow | 0.2% | 0.9% | -75.7% |
Gold | 0.1% | 4.0% | -96.8% |
Purple | 0.1% | 1.0% | -92.7% |
Grayscale Colors (White, Black, Gray, Silver) | 80.0% | 60.3% | 32.6% |
Non-Grayscale Colors | 20.0% | 39.7% | -49.6% |
“If drivers think they’re seeing less color on the roads these days, they are,” said Brauer. “Every non-grayscale color lost ground over the past 20 years, leading to the undeniable dilution of our car color spectrum.”
Colors By Vehicle Type: Trucks, SUVs, Passenger Cars, and Sports Cars
When broken out by vehicle type the market share numbers remain fairly consistent across trucks, SUVs, and passenger cars. Grayscale colors make up around 80 percent share for each of these three segments. The one exception is sports cars, where owner expression through exterior color choice has limited grayscale share to 62.4 percent.
Truck Color Market Share - iSeeCars Study | |||
Color | 2023 | 2004 | % Change |
Beige | 0.7% | 3.1% | -77.6% |
Black | 20.0% | 14.4% | 39.3% |
Blue | 9.6% | 9.5% | 0.5% |
Brown | 0.5% | 2.7% | -79.4% |
Gold | 0.1% | 2.5% | -97.5% |
Gray | 20.6% | 11.6% | 77.5% |
Green | 1.7% | 3.9% | -56.9% |
Orange | 0.4% | 0.5% | -28.2% |
Purple | 0.0% | 1.4% | -97.4% |
Red | 7.2% | 16.8% | -56.9% |
Silver | 7.9% | 12.7% | -37.9% |
White | 30.9% | 19.8% | 56.5% |
Yellow | 0.4% | 1.2% | -67.9% |
Grayscale Colors (White, Black, Gray, Silver) | 79.4% | 58.4% | 35.9% |
Non-Grayscale Colors | 20.6% | 41.6% | -50.5% |
“Trucks followed the overall market trend, though some primary colors, like red, lost far more share than others, like blue,” said Brauer. “Red is down 57 percent in the truck segment, while blue lost less than 1 percent.”
SUV Color Market Share - iSeeCars Study | |||
Color | 2023 | 2004 | % Change |
White | 26.7% | 14.7% | 81.9% |
Black | 23.1% | 15.8% | 45.9% |
Gray | 21.1% | 10.4% | 102.4% |
Silver | 9.2% | 19.4% | -52.8% |
Blue | 8.5% | 11.2% | -24.5% |
Red | 7.1% | 9.2% | -23.3% |
Green | 2.5% | 5.3% | -52.3% |
Brown | 0.5% | 3.5% | -85.7% |
Beige | 0.5% | 3.6% | -87.2% |
Orange | 0.3% | 0.6% | -47.2% |
Gold | 0.2% | 4.5% | -95.7% |
Yellow | 0.2% | 0.8% | -75.6% |
Purple | 0.0% | 0.9% | -94.5% |
Grayscale Colors (White, Black, Gray, Silver) | 80.2% | 60.4% | 32.7% |
Non-Grayscale Colors | 19.8% | 39.6% | -49.9% |
“Gray’s popularity across the SUV segment had it more than doubling in market share,” said Brauer. “White and black also saw big gains among SUV shoppers, with those three colors’ gains coming at the expense of silver, green, blue, and red.”
Passenger Car Color Market Share - iSeeCars Study | |||
Color | 2023 | 2004 | % Change |
White | 24.8% | 12.3% | 101.8% |
Gray | 22.7% | 13.0% | 73.9% |
Black | 21.6% | 13.6% | 58.8% |
Blue | 9.9% | 11.0% | -10.1% |
Silver | 9.4% | 22.9% | -58.9% |
Red | 8.2% | 11.2% | -26.4% |
Green | 1.2% | 3.0% | -59.3% |
Orange | 1.0% | 0.6% | 61.4% |
Beige | 0.4% | 3.4% | -87.8% |
Yellow | 0.3% | 1.0% | -70.3% |
Purple | 0.2% | 0.9% | -78.9% |
Brown | 0.1% | 2.6% | -94.4% |
Gold | 0.1% | 4.4% | -98.5% |
Grayscale Colors (White, Black, Gray, Silver) | 78.5% | 61.9% | 26.9% |
Non-Grayscale Colors | 21.5% | 38.1% | -43.6% |
“Cars have lost appeal in the consumer market, but they continue to serve in rental car fleets and other commercial uses,” said Brauer. “This likely explains the more than doubling of share for white in the car segment, a color popular with fleet managers due to its relatively high durability and low maintenance costs.”
Sports Car Color Market Share - iSeeCars Study | |||
Color | 2023 | 2004 | % Change |
Gray | 20.1% | 11.1% | 81.0% |
White | 19.4% | 6.3% | 209.7% |
Black | 19.4% | 19.8% | -2.1% |
Red | 14.3% | 22.0% | -35.1% |
Blue | 13.2% | 10.9% | 20.7% |
Silver | 3.5% | 20.9% | -83.0% |
Green | 3.4% | 0.5% | 537.0% |
Orange | 3.4% | 1.9% | 76.4% |
Yellow | 2.0% | 4.9% | -59.3% |
Purple | 0.8% | 0.9% | -10.1% |
Beige | 0.3% | 0.3% | -4.8% |
Brown | 0.2% | 0.2% | 3.7% |
Gold | 0.0% | 0.3% | -85.2% |
Grayscale Colors (White, Black, Gray, Silver) | 62.4% | 58.1% | 7.5% |
Non-Grayscale Colors | 37.5% | 41.9% | -10.3% |
“The sports car segment managed to break the industry pattern, with grayscale colors only gaining 4.3 percent share since 2004,” said Brauer. “White more than tripled in this segment, and gray jumped by 81 percent, but those gains were mostly offset by silver falling 83 percent and black losing 2.1 percent. Red also lost ground with sports car buyers, while blue and orange made substantial gains.”
The next few years could be very telling in the car color world. Will gray continue to gain favor, surpassing long-dominant black and approaching white’s top spot? Will the grayscale shades continue to absorb market share, making our roadways less colorful, or has their popularity finally peaked?
More from iSeeCars.com:
Methodology
iSeeCars analyzed the colors of over 20 million used cars from model years 2004 - 2023 sold from January 2023 to April 2024. The share of each color within each model year was calculated, as was the difference in share between model years 2004 and 2023.
About iSeeCars.com
This article, Cars are Half as Colorful as They Were 20 Years Ago, originally appeared on iSeeCars.com.
