Yahoo Autos
 Kinsa's fever map could show just how crucial it is to stay home to stop COVID-19 spread
Smart thermometer maker Kinsa has been working on building accurate, predictive models of how seasonal illnesses like the flu travel in and among communities -- and its fever map is finding new utility as the novel coronavirus pandemic grows globally. While Kinsa's US Health Weather Map has no way of tracking the spread of COVID-19 specifically, as it looks only at fevers tied to geographic data, it could provide easy-to-grasp early indicators of the positive effects of social distancing and isolation measures at the community level.
At the time that Kinsa's health weather map was covered in the New York Times in February, the company had around a million thermometers in market in the U.S., but it had experienced a significant increase in order volume of as many as 10,000 units per day in the week prior to its publication. That means that the company's analytics are based on a very large data set relative to the total U.S. population. Kinsa founder and CEO Inder Singh told me this allowed them to achieve an unprecedented level of accuracy and granularity in flu forecasting down to the community level, working in partnership with Oregon State University Assistant Professor Ben Dalziel.
"We showed that the core hypothesis for why I started the company is real -- and the core hypothesis was you need real-time, medically accurate, geolocated data that's taken from people who've just fallen ill to detect outbreaks and predict the spread of illness," Singh said. "What we did with our data is we punched it into Ben's existing, first-principle models on infectious disease spread. And we were able to show that on September 15, we could predict the entire rest of cold and flu season with hyper-accuracy in terms of the peaks and the valleys -- all the way out to the rest of flu season, i.e. 20 weeks out on a hyperlocal basis."
Prior to this, there have been efforts to track and predict flu transmission, but the "state-of-the-art" to date has been predictions at the national or multi-state level -- even trends in individual states, let alone within communities, was out of reach. And in terms of lead time, the best achievable was essentially three weeks out, rather than multiple months, as is possible with Kinsa and Dalziel's model.
Even without the extraordinary circumstances presented by the global COVID-19 pandemic, what Singh, Dalziel and Kinsa have been able to accomplish is a major step forward in tech-enabled seasonal illness tracking and mitigation. But Kinsa also turned on a feature of their health weather map called "atypical illness levels" a month ago, and that could prove an important leading indicator in shedding more light on the transmission of COVID-19 across the U.S. -- and the impact of key mitigation strategies like social distancing.
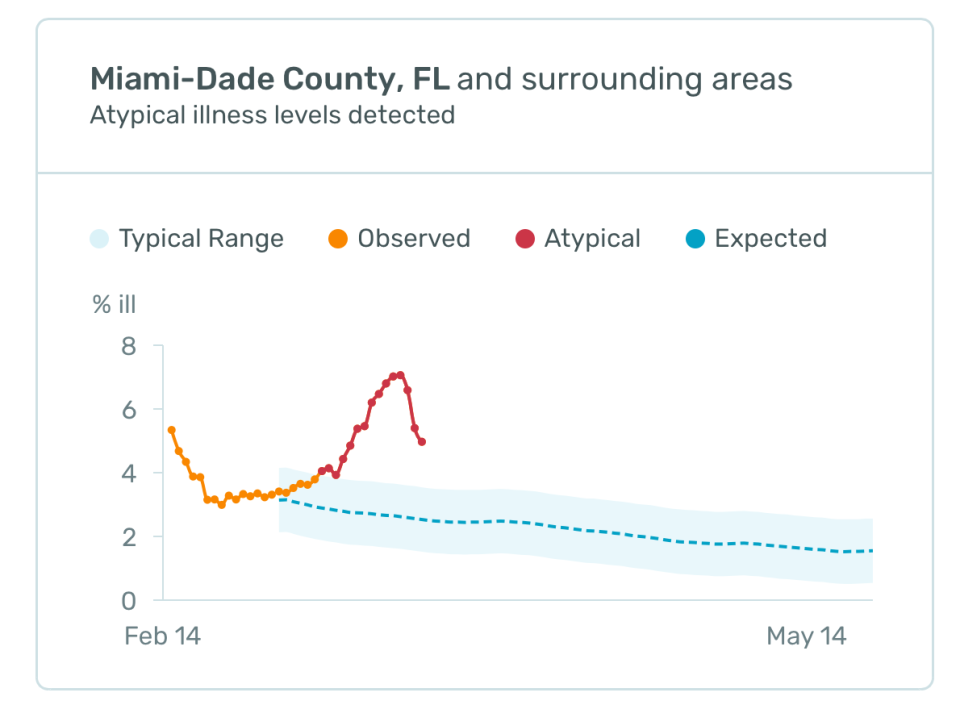
"We're taking our real-time illness signal, and we're subtracting out the expectation," Singh says, explaining how the new view works. "So what you're left with is atypical illness. In other words, a cluster of fevers that you would not expect from normal cold and flu time. So, presumably, that is COVID-19; I cannot definitively say it's COVID-19, but what I can say is that it's an unusual outbreak. It could be an anomalous flu, a strain that's totally unexpected. It could be something else, but at least a portion of that is almost certainly going to be COVID-19."

The 'atypical illness' view of Kinsa's US Health Weather Map. Red indicates much higher than expected levels of illness, as indicated by fever.