
 Yahoo Autos
 What Is The Ownership Structure Like For NEXT plc (LON:NXT)?

The big shareholder groups in NEXT plc (LON:NXT) have power over the company. Generally speaking, as a company grows, institutions will increase their ownership. Conversely, insiders often decrease their ownership over time. Companies that used to be publicly owned tend to have lower insider ownership.
NEXT has a market capitalization of UK£6.6b, so it's too big to fly under the radar. We'd expect to see both institutions and retail investors owning a portion of the company. In the chart below, we can see that institutional investors have bought into the company. We can zoom in on the different ownership groups, to learn more about NEXT.
View our latest analysis for NEXT
What Does The Institutional Ownership Tell Us About NEXT?
Many institutions measure their performance against an index that approximates the local market. So they usually pay more attention to companies that are included in major indices.
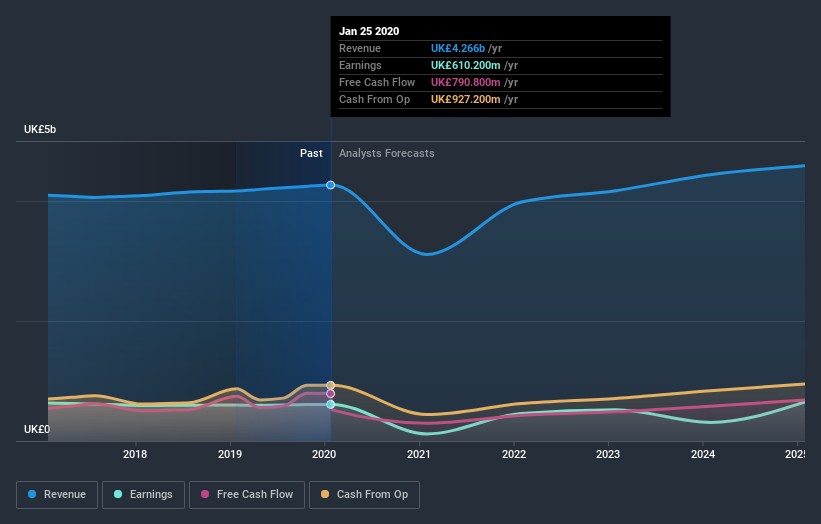
We can see that NEXT does have institutional investors; and they hold a good portion of the company's stock. This implies the analysts working for those institutions have looked at the stock and they like it. But just like anyone else, they could be wrong. When multiple institutions own a stock, there's always a risk that they are in a 'crowded trade'. When such a trade goes wrong, multiple parties may compete to sell stock fast. This risk is higher in a company without a history of growth. You can see NEXT's historic earnings and revenue, below, but keep in mind there's always more to the story.
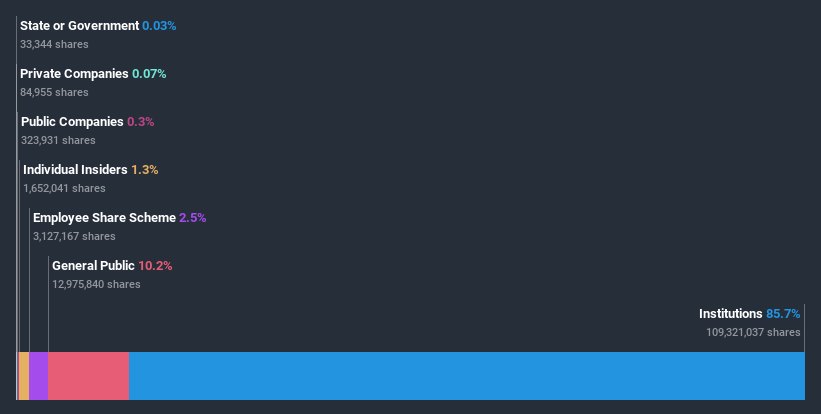
Investors should note that institutions actually own more than half the company, so they can collectively wield significant power. We note that hedge funds don't have a meaningful investment in NEXT. FMR LLC is currently the largest shareholder, with 12% of shares outstanding. BlackRock, Inc. is the second largest shareholder owning 9.9% of common stock, and Invesco Ltd. holds about 6.8% of the company stock. In addition, we found that Simon Wolfson, the CEO has 0.0108977 of the shares allocated to his name
A closer look at our ownership figures suggests that the top 11 shareholders have a combined ownership of 51% implying that no one share holder has a majority.
While it makes sense to study institutional ownership data for a company, it also makes sense to study analyst sentiments to know which way the wind is blowing. There are plenty of analysts covering the stock, so it might be worth seeing what they are forecasting, too.
Insider Ownership Of NEXT
The definition of an insider can differ slightly between different countries, but members of the board of directors always count. The company management answer to the board; and the latter should represent the interests of shareholders. Notably, sometimes top-level managers are on the board, themselves.
I generally consider insider ownership to be a good thing. However, on some occasions it makes it more difficult for other shareholders to hold the board accountable for decisions.
I can report that insiders do own shares in NEXT plc. The insiders have a meaningful stake worth UK£85m. I sometimes take an interest in whether they have been buying or selling.
General Public Ownership
With a 10% ownership, the general public have some degree of sway over NXT. This size of ownership, while considerable, may not be enough to change company policy if the decision is not in sync with other large shareholders.
Next Steps:
It's always worth thinking about the different groups who own shares in a company. But to understand NEXT better, we need to consider many other factors. For example, we've discovered 1 warning sign for NEXT that you should be aware of before investing here.
But ultimately it is the future, not the past, that will determine how well the owners of this business will do. Therefore we think it advisable to take a look at this free report showing whether analysts are predicting a brighter future.
NB: Figures in this article are calculated using data from the last twelve months, which refer to the 12-month period ending on the last date of the month the financial statement is dated. This may not be consistent with full year annual report figures.
This article by Simply Wall St is general in nature. It does not constitute a recommendation to buy or sell any stock, and does not take account of your objectives, or your financial situation. We aim to bring you long-term focused analysis driven by fundamental data. Note that our analysis may not factor in the latest price-sensitive company announcements or qualitative material. Simply Wall St has no position in any stocks mentioned.
Have feedback on this article? Concerned about the content? Get in touch with us directly. Alternatively, email editorial-team@simplywallst.com.
