
 Yahoo Autos
For pickup trucks, more than half all fuel savings come in 2022-2025 CAFE rules
Sometimes, when science and technology issues have economic or political consequences, incorrect or misleading information and analyses can be propagated through the media, leading both decision makers and the public astray.
A piece published in April by Forbes, covering the effects of the 2022 through 2025 corporate average fuel economy standards, is a case in point.
With the news that the NHTSA is now considering not just freezing vehicle-emission standards at 2021 levels, but possibly rolling them back to earlier and lower figures, proper analysis and understanding becomes even more important.
DON'T MISS: NHTSA to review gas-mileage rules: could freeze 2021 limits, even roll back (updated)
The gist of the Forbes article was to downplay the importance of the CAFE rules for 2022 through 2025.
"According to the EPA’s own estimates," wrote author Sam Ori, "the overwhelming majority—nearly 90 percent—of originally projected fuel savings under the current policy will have been locked into place by 2021" (my emphasis).
But the EPA said no such thing, and it did not provide that estimate. (An explanation of the mechanics of Ori's calculation is included at the end of this article.)
The statement seems to imply that 90 percent of the consumption reduction occurs between the years 2012 and 2021 (the first of two phases of emissions reductions from 2012 through 2025), while only 10 percent occurs during the second phase, from 2022 to 2025.
To readers who interpreted the statement in that way, it's wildly misleading. So let’s set the record straight.
First, CAFE regulations are, well, complicated. There are separate rules for cars versus trucks. The requirements depend on the size (footprint) of the vehicle.
CHECK OUT: Ruling that EPA must regulate carbon emissions: now 10 years old
Window-sticker fuel economy on the vehicle is "adjusted" through a variety of calculations to reflect on-the-road reality, but CAFE rules work off unadjusted numbers taken directly from the fuel consumed in emission testing.
There is also the non-linear nature of MPG, which can be confusing and misleading itself.
This article tries to keep the jargon to a minimum, to focus on the significant impact the 2022-2025 rules will have on reducing fuel consumption, and the resulting pollutants emitted by that fuel consumption.
![Figure 1: Passenger-car fuel consumption under CAFE standards by year [graph: John Briggs]](https://s.yimg.com/ny/api/res/1.2/pyb5ubRqlT5DPvK6Lc3TfQ--/YXBwaWQ9aGlnaGxhbmRlcjt3PTY0MDtoPTQ0Ng--/https://s.yimg.com/os/en_US/Autos/GreenCarReports/passenger-car-fuel-consumption-under-cafe-standards-by-year-graph-john-briggs_100617040_s.jpg)
Figure 1 shows the CAFE standards for cars, and how they must improve over the years from 2012 through 2025.
The vertical axis is in units of consumption (gallons per 1,000 miles) to eliminate the non-linearity issues associated with miles per gallon, its inverse.
There are three lines for different sizes of vehicles, showing footprints of 40, 47, and 56 square feet, which roughly correspond to a Honda Fit subcompact hatchback, a Honda Accord mid-size sedan, and Mercedes S-class large luxury sedan in size.
CAFE allows larger vehicles to consume more fuel than smaller ones, allowing buyers to select from various sizes and classes of vehicles.
The rate of decrease in consumption is more or less linear with time: roughly 70 percent of the decrease occurs from 2012 through 2021, while the remaining 30 percent occurs from 2022 through 2025.
So rather than the 90-percent/10-percent split implied by Ori, the 2012-2021 and 2022-2025 CAFE rules are split 70 to 30. But that is just the start of the story.
![Figure 2: Light-truck fuel consumption under CAFE standards by year [graph: John Briggs]](https://s.yimg.com/ny/api/res/1.2/a5CvtEeFznYE2xbse3lDqA--/YXBwaWQ9aGlnaGxhbmRlcjt3PTY0MDtoPTQ0NA--/https://s.yimg.com/os/en_US/Autos/GreenCarReports/light-truck-fuel-consumption-under-cafe-standards-by-year-graph-john-briggs_100617041_s.jpg)
Figure 2 shows the same data, this time for light trucks. Three curves are shown for different vehicles, with footprints of 40, 55, and 75 square feet, which roughly represent a Honda HR-V compact crossover, a Honda Pilot mid-size crossover, and Ford F150 SuperCab full-size pickup truck with a 6.5-foot bed.
The highly non-linear nature of the last (green) curve is most interesting.
Curiously, the EPA and the NHTSA have each given the largest trucks a pass from 2017 to 2021, and require almost no improvement in fuel efficiency during this period.
This is presumably so manufacturers can prepare for the 2022-2025 period, during which these large-footprint "light" trucks need to show the most improvement of any vehicle type.
For the biggest light trucks, only 45 percent of their efficiency improvement during the years 2012-2025 comes through 2021.
More than half, or 55 percent, occurs during the 2022-2025 period now under review at the EPA—led by climate-science denier Scott Pruitt, who hails from a state where trucks like the F150 are particularly popular—and simultaneously at the NHTSA.
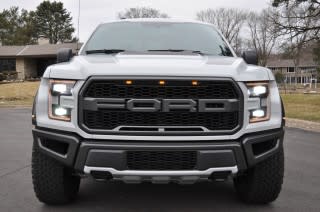
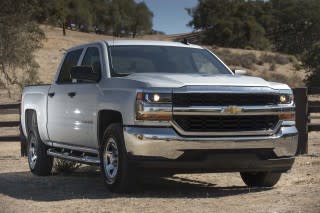
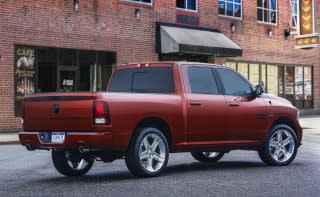
So, for large-footprint trucks like the Chevrolet Silverado, Ford F-Series, and Ram pickups, Sam Ori’s implied 90/10 split is actually 45 percent and 55 percent—with the years 2022 through 2025 being crucially important.
It would appear that back in 2012, the EPA and NHTSA quietly agreed with truck makers—who are predominantly the Detroit Three, let's face it—to push the majority of their improvement into the last four years of the CAFE program.
![Figure 3: Passenger-car fuel economy targets under CAFE standards by year [graph: John Briggs]](https://s.yimg.com/ny/api/res/1.2/h2jFIBKwrkASlBoaTFl38g--/YXBwaWQ9aGlnaGxhbmRlcjt3PTY0MDtoPTQ1Ng--/https://s.yimg.com/os/en_US/Autos/GreenCarReports/passenger-car-fuel-economy-targets-under-cafe-standards-by-year-graph-john-briggs_100617042_s.jpg)
![Figure 4: Light-truck fuel economy targets under CAFE standards by year [graph: John Briggs]](https://s.yimg.com/ny/api/res/1.2/wx_0tyBuUlRSCW.zT0AhrQ--/YXBwaWQ9aGlnaGxhbmRlcjt3PTY0MDtoPTQ1Mg--/https://s.yimg.com/os/en_US/Autos/GreenCarReports/light-truck-fuel-economy-targets-under-cafe-standards-by-year-graph-john-briggs_100617043_s.jpg)
![Figure 5: Passenger-car fuel consumption under CAFE standards by footprint [graph: John Briggs]](https://s.yimg.com/ny/api/res/1.2/yK5PbEhJPu7nUk9i97CbKw--/YXBwaWQ9aGlnaGxhbmRlcjt3PTY0MDtoPTQ2MA--/https://s.yimg.com/os/en_US/Autos/GreenCarReports/passenger-car-fuel-consumption-under-cafe-standards-by-footprint-graph-john-briggs_100617044_s.jpg)
![Figure 6: Light-truck fuel consumption under CAFE standards by footprint [graph: John Briggs]](https://s.yimg.com/ny/api/res/1.2/WW2sjlmhVGiE26rzZhHHcg--/YXBwaWQ9aGlnaGxhbmRlcjt3PTY0MDtoPTQ1Ng--/https://s.yimg.com/os/en_US/Autos/GreenCarReports/light-truck-fuel-consumption-under-cafe-standards-by-footprint-graph-john-briggs_100617045_s.jpg)
Now, automakers are finding a sympathetic ear in the Trump Administration to back away from that deal, arguing the exigencies of continued cheap gasoline prices.
Environmental groups argue that the critical issues of pollution and climate change cannot wait, and the CAFE program should continue according to the schedule agreed to by all parties more than five years ago.
If anything, the growing consumer preference for SUVs and trucks (mostly counted as light trucks by the EPA) over passenger cars makes the rules even more important. Most of the gains for the largest of those light trucks occur only late in the CAFE program.
So if the someone—Sam Ori or anyone else—tries to tell you that 90 percent of the gains in the CAFE program will occur by 2021, and the 2022-2025 rules are unimportant, you can confidently counter by pointing out that's just not true.
For cars, fully 30 percent of the improvement comes in the later years.
For the largest and thirstiest class of light vehicles in the U.S.—full-size pickup trucks—fully 55 percent of the gains come during the period in which the rules could now be frozen, even rolled back.
Most analysts agree that full-size pickup trucks are hugely profitable for the domestic makers, now selling at average prices well above $40,000 (against $30,000 to $35,000 for all vehicles, depending month).
Ford's F-Series pickup truck, in fact, has been the single most popular vehicle line in the U.S. for 20 years or more.
The auto industry reflexively fights all attempts to regulate any aspect of its products or services, and has done so since the 1960s.
But this fight appears to have three very specific beneficiaries.
It should at least be fought with an accurate understanding of the rules and their effects.
UPDATE: Ori calculated his "90 percent" savings based on Table 7.4-1 in the joint EPA-NHTSA regulatory impact analysis of the 2025 rule. That table shows the lifetime fuel savings, in gallons, for each year of the program.
Ori looked at the difference between the savings in years 2022 through 2025 from the stiffened regulations versus the savings that would be achieved through 2025 if standards were held at the 2021 levels.
The calculation multiplies the earlier years' savings by 10 (for the 10 years from 2012 through 2021), but only multiplies the savings for 2022 through 2025 by 4.
Unlike the earlier rules, which are assumed to be fully achieved, the calculation implicitly considers only the middle value of the saving: the level achieved at the end of the first two years, or in December 2023.
In other words, he is looking at estimated savings only a short time after the new standards kick in—and using a time factor that ensures they will look worse over shorter periods of time than over longer periods.
It would be like going on a diet, consistently losing weight, but then reporting your weight as it was a few months earlier—not your final weight.
References
Light-Duty Vehicle Greenhouse Gas Emission Standards and Corporate Average Fuel Economy Standards; Final Rule, CAFE-GHG_MY_2012-2016_Final_ Rule_FR.pdf Table IV.E.2–2 and Table IV.E.4–2 show the curve coefficients for the MPG curves for the 2012-2016 period.
2017-2025 Model Year Light-Duty Vehicle GHG Emissions and CAFE Standards: Supplemental, 2017-2025_CAFE-GHG_ Supplemental_NOI07292011.pdf, Table A.1 shows the curve coefficients for the MPG curves. Charts A.1 and A.2 show the MPG data.
Calculations and graphs used in this article: “Cafe numbers impact of 2022-2025.xlsx” https://drive.google.com/open? id= 0B6b4vfm14vUtUXBTLWYzZ2YzNVE
EDITOR'S NOTE: We're grateful to contributor and faithful reader John Briggs for delving into and clarifying the issues on how much fuel consumption would be reduced by the 2022 through 2025 EPA emission limits. It's investigative work we simply didn't have the resources to do, and we appreciate the time and effort Briggs contributed for the educational benefit of all readers.
_______________________________________
