
 Yahoo Autos
 The South’s soaring COVID rates show why we need vaccine mandates so urgently
On July 4, 1776, the First Continental Congress appointed Thomas Jefferson, John Adams, and Benjamin Franklin to a committee to design “a seal for the United States of America.” The motto they proposed a month later was the Latin phrase “E Pluribus Unum,” which was adopted by Congress six years later. This founding spirit of unity is now being challenged, improbably and irresponsibly, by politically motivated responses to the public health crisis caused by the COVID-19 pandemic.
Some of these political voices reached a fever pitch last week as President Biden announced a unified national vaccine mandate for large employers in the aftermath of 650,000 deaths from the pandemic, which continues to devastate communities across the nation with 1,500 new deaths each day. (On Sept. 15, President Biden hosted a group of CEOs of major U.S. employers including Walt Disney, Microsoft, and Walgreens Boots, to compare approaches and work on the implementation his Covid-19 mandates.) In South Carolina, the state currently with the highest COVID-19 case incidence and with more than 2,500 of its citizens currently hospitalized with COVID-19, Gov. Henry McMaster vowed to fight Biden and his party “to the gates of hell.” The regional outrage against such a mandate from twenty GOP governors, including those from the southern states of Texas, Florida, Georgia, Mississippi, and Alabama, is particularly appalling because these states have experienced disproportionately greater morbidity and mortality since the launch of the vaccines, as we show below.
The COVID pandemic in the U.S. has been met with widely divergent approaches and attitudes by state legislatures, governors, and other civic leaders like university presidents and clergymen. This divergence has created vast differences in health outcomes and turned the population of many states into unwitting human subjects of a large scale, unplanned experiment. Though there have been persistent disparities in U.S. health outcomes by region, ethnicity/race, gender, and socioeconomic status, the magnitude of these disparities pales in comparison with what we now see in the regional and state-by-state variation in the incidence of COVID-19 cases, hospitalizations, and deaths.
In December 2020 and early 2021, COVID-19 became the leading cause of death in the U.S., surpassing heart disease and cancer. The subsequent rapid deployment of COVID-19 vaccines in the early months sharply curtailed mortality, but as the vaccine uptake began to stall and the more infectious Delta variant spread throughout the country, COVID-19 re-emerged as the third leading cause of death in August 2021.
This is troubling enough, but it is shockingly more troubling to see the extent to which COVID-19-related health outcomes have diverged across states since March 2021, when vaccines became widely available. Based on data we obtained from CDC’s COVID Data Tracker site, the highest 7-day case incidence (South Carolina, as of Sept. 9) exceeded the lowest case incidence (Connecticut) by a factor of 6.2. The state with the largest total number of per capita hospitalizations since March 1, 2021 (Kentucky) exceeds the state with the lowest hospitalizations (Vermont) by a factor of 8.9. And Florida, the state with the highest per capita number of COVID-19 deaths since March 1, has a COVID mortality rate 8.4 times greater than Vermont’s.
These are staggering differences, and they dwarf the disparities that health experts have long worried about. According to CDC data from 1999 to 2019 compiled by Kaiser Family Foundation (KFF), cancer deaths per 100,000 people varied by a factor of 1.5 from the highest (Mississippi) to the lowest (Utah). Similarly, deaths due to heart disease per 100,000 people varied by a factor of 1.9 from the highest (Oklahoma) to the lowest (Hawaii).
COVID-19’s death toll did not have to be so tragic. If Florida and Texas had COVID-19 mortality rates on par with Vermont’s, they would have saved, respectively, almost 14,000 and 9,000 lives since March 1. If the rest of the nation had the mortality rate of New England’s, we would have saved almost 90,000 lives since March 1.
The single, salient explanatory factor for these wide variances in COVID-19 morbidity and mortality across the states is vaccination. Politically motivated opposition to vaccines by several state governors and/or legislatures has caused vaccination rates to diverge substantially across states. The following chart shows the gap between two regions, New England and the South; the disparity between individual states, like Vermont (68% fully vaccinated) and Mississippi (40%), is even wider.
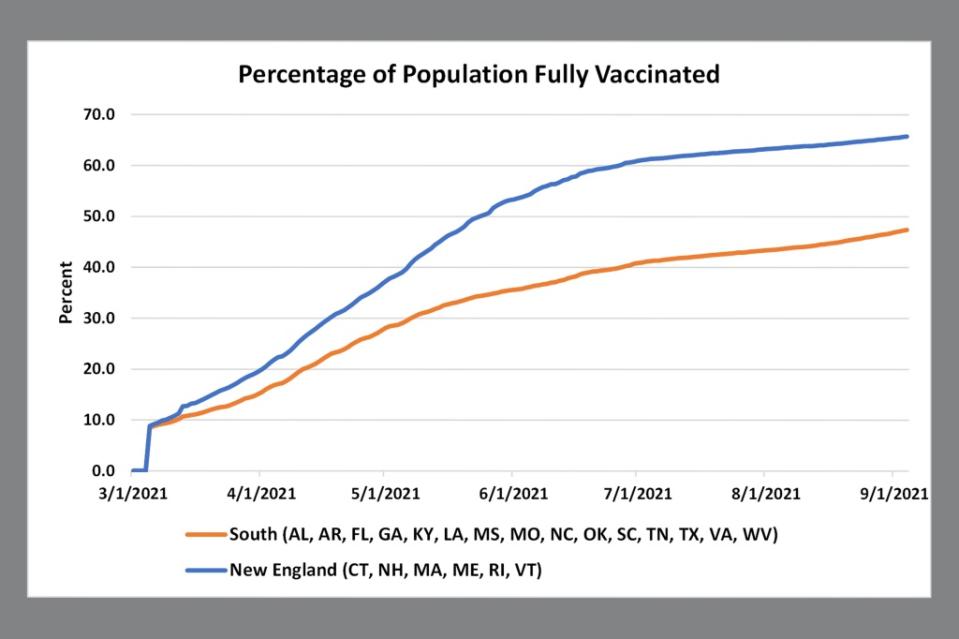
Source: CDC COVID Data Tracker; extracted September 9, 2021.
Our observation that the vaccination rate is the principal determinant of differences in health outcomes between states can be demonstrated using standard statistical methods, but it is also plainly visible in the charts below.
Vaccination, cases, hospitalizations, and deaths
The following scatterplots show how well states with high vaccination rates have done against the Delta wave. First, note the strong (inverse) correlation between current vaccination percentage and the 7-day case incidence per 100,000 people.
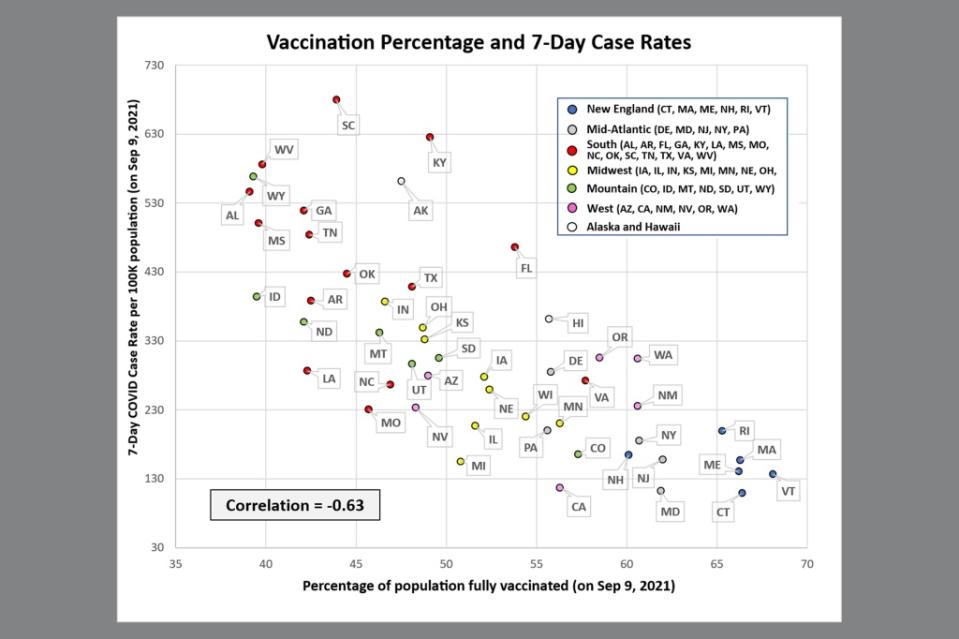
Source: CDC COVID Data Tracker; extracted September 9, 2021.
The previous chart is a recent snapshot of health outcomes, but the pattern is essentially the same when we consider severe outcomes of COVID-19. The next scatterplot shows the correlation between vaccination rate and the total number of hospitalizations per 100,000 people since March 1, 2021.
