
 Yahoo Autos
Traffic deaths continued sharp increase in 2016: highest number of fatalities since 2007
It's only January, and official stats on traffic fatalities for 2016 aren't expected for at least 10 more months. However, early estimates from the National Highway Traffic Safety Administration suggest that auto-related deaths surged during the first nine months of last year.
If those stats prove accurate, they would signal a disturbing trend in traffic fatalities. After several years of progressive declines, 2015 saw a sharp uptick in roadway deaths, jumping to 35,092. That's more than seven percent higher than the 32,744 recorded in 2014.
ALSO SEE: How to be sure you're buying an IIHS Top Safety Pick+ car
According to NHTSA, though, 2016 could shape up to be far, far deadlier.
Between January 1 and September 30 of last year, approximately 27,875 vehicle occupants, bicyclists, and pedestrians were killed in car collisions. That's an eight percent jump from the 25,808 deaths recorded during the first three quarters of 2015--which was itself 8.3 percent higher than the 28,834 during the same period of 2014.
The last time NHTSA recorded such a high number of deaths was 2007, when 31,021 people lost their lives in nine months on U.S. roads.
If you look at the fatality rate--that is, the number of deaths per million miles traveled--the stats aren't much better. The first nine months of 2016 had an estimated fatality rate of 1.15. You'd have to scroll back to 2008 to top that. (That year, the figure was 1.26.)
Behind the numbers
What's driving the increase? It's impossible to say at this point, and NHTSA won't offer any analysis until hard-and-fast numbers roll in.
However, two things are very clear:
1. The increase isn't solely related to an increase in travel. Though Americans put about 70 billion more miles on their odometers last year than they did the year before, that's only a three percent increase above 2015. If travel grew three percent and fatalities jumped eight percent, there's obviously something else at work here.
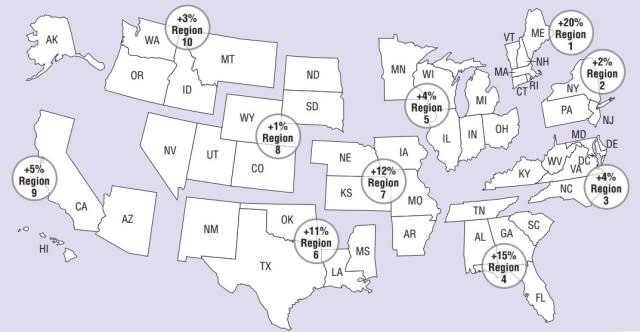
2. The increase isn't distributed evenly. As you can see from the graphic above, every area of the country saw an increase in auto-related deaths during the first nine months of 2016. However, in parts of the South and Southwest, growth surged by double-digits, and figures in the far Northeast jumped by a whopping 20 percent.
Until NHTSA publishes its final data, all we can do is play the guessing game. If you'd care to join us, share your thoughts in the comments below. You can see a PDF of NHTSA's early estimates here.
It's only January, and official stats on traffic fatalities for 2016 aren't expected for at least 10 more months. However, early estimates from the National Highway Traffic Safety Administration suggest that auto-related deaths surged during the first nine months of last year.
If those stats prove accurate, they would signal a disturbing trend in traffic fatalities. After several years of progressive declines, 2015 saw a sharp uptick in roadway deaths, jumping to 35,092. That's more than seven percent higher than the 32,744 recorded in 2014.
ALSO SEE: How to be sure you're buying an IIHS Top Safety Pick+ car
According to NHTSA, though, 2016 could shape up to be far, far deadlier.
Between January 1 and September 30 of last year, approximately 27,875 vehicle occupants, bicyclists, and pedestrians were killed in car collisions. That's an eight percent jump from the 25,808 deaths recorded during the first three quarters of 2015--which was itself 8.3 percent higher than the 28,834 during the same period of 2014.
The last time NHTSA recorded such a high number of deaths was 2007, when 31,021 people lost their lives in nine months on U.S. roads.
If you look at the fatality rate--that is, the number of deaths per million miles traveled--the stats aren't much better. The first nine months of 2016 had an estimated fatality rate of 1.15. You'd have to scroll back to 2008 to top that. (That year, the figure was 1.26.)
Behind the numbers
What's driving the increase? It's impossible to say at this point, and NHTSA won't offer any analysis until hard-and-fast numbers roll in.
However, two things are very clear:
1. The increase isn't solely related to an increase in travel. Though Americans put about 70 billion more miles on their odometers last year than they did the year before, that's only a three percent increase above 2015. If travel grew three percent and fatalities jumped eight percent, there's obviously something else at work here.
2. The increase isn't distributed evenly. As you can see from the graphic above, every area of the country saw an increase in auto-related deaths during the first nine months of 2016. However, in parts of the South and Southwest, growth surged by double-digits, and figures in the far Northeast jumped by a whopping 20 percent.
Until NHTSA publishes its final data, all we can do is play the guessing game. If you'd care to join us, share your thoughts in the comments below. You can see a PDF of NHTSA's early estimates here.
